• MONIT Widget

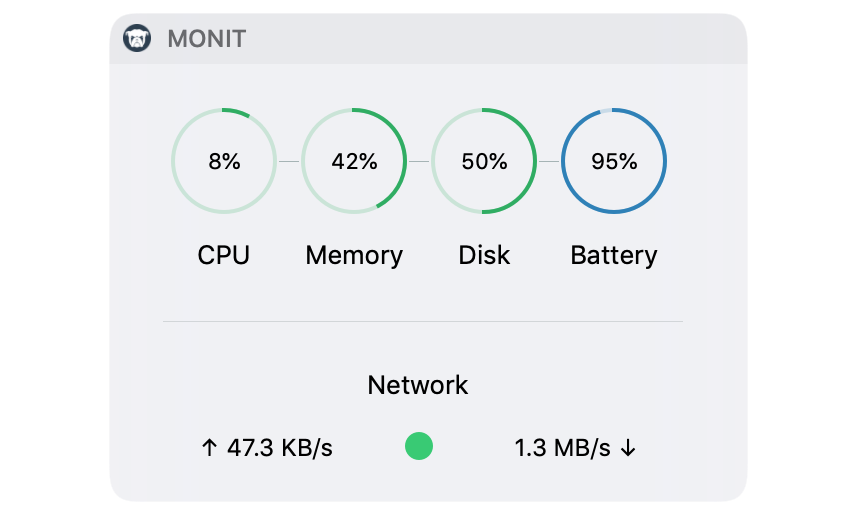
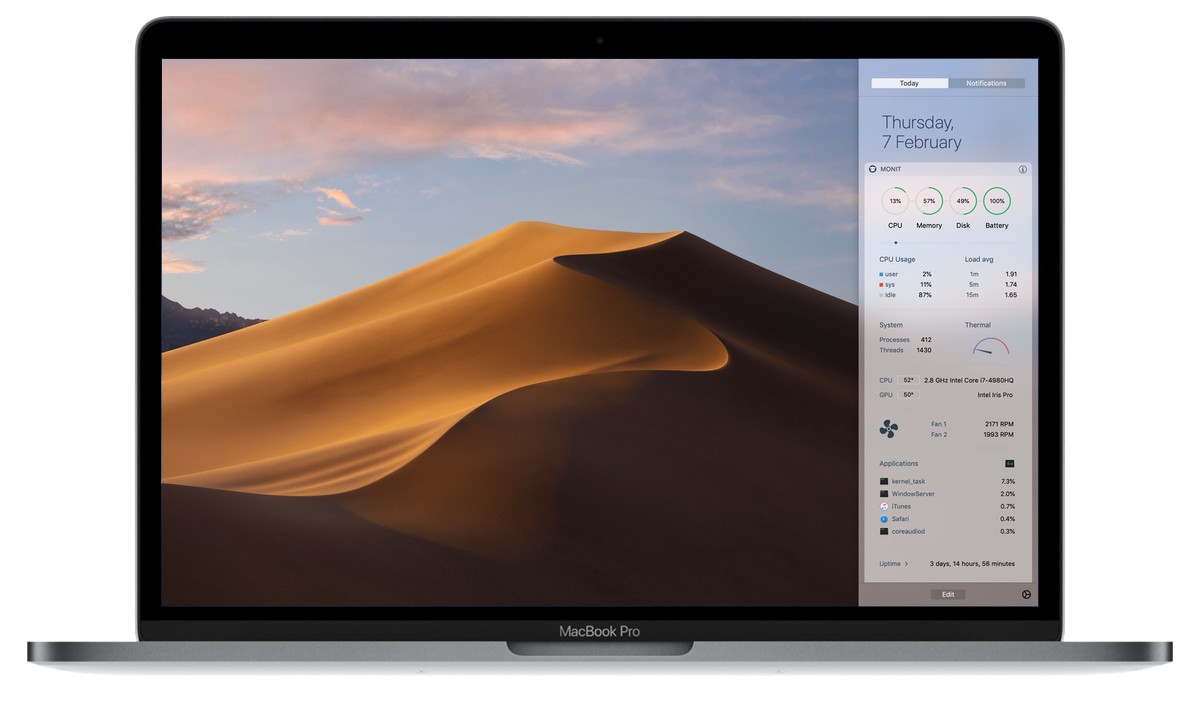
    Slide out Notification Center to quickly see key performance indicators for your Mac, such as CPU, Memory, Disk, Network and Battery. Click the gauges to drill down for more details.

    See MONIT in action70 seconds

  • Splash
  • Macbook Image
  • Features

    Monitor the following performance indicators:

    • CPU

      Usage, Load, Temperature, Thermal state, Fan-Speed, Applications, Uptime

    • Memory

      Used, Free, Wired, Compressed, Applications, Swap, Pages in/out

    • Disks

      Mounted Disks, Space Usage, Disk I/O, S.M.A.R.T status, Temperature

    • Battery

      Time remaining, Health, Wattage, Temperature, Capacity, Age, Cycles

    • Networks

      Connected state, Public IP, Local IP, Mac-Address, Link Speed, Uploaded and Downloaded bytes

    • User Interface

      Carefully designed, Persistent User Interface, Color themes, Swipe to access on Macbooks

  • CPU

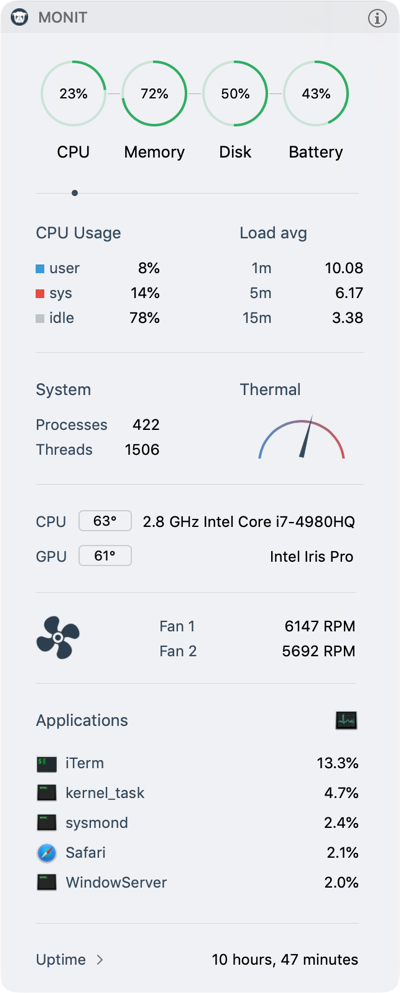
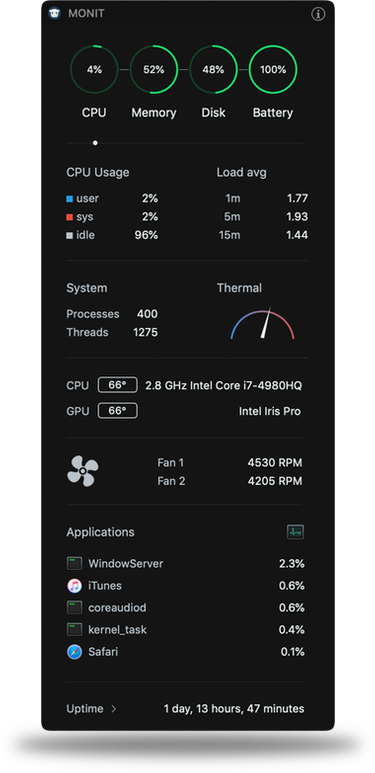
    CPU Usage is reported for the entire system. user is the amount of time the CPU was busy executing code in user space, sys the amount of time the CPU was busy executing code in kernel space and idle measures unused CPU capacity.

    The Load is a measure of the amount of computational work that a computer system performs. The Load Average represents the average system load over a period of time. The three numbers represent the system load during the last one-, five-, and fifteen-minute periods.

    System reports the number of processes and threads running on the system.

    The Thermal gauge represents the overall thermal state of the system. There are 4 thermal levels; normal, fair (fans running), serious and critical. The screenshot shows the indicator at the fair level.

    The CPU model and current GPU model. The GPU model changes depending on, if the system uses the integrated or the discrete GPU. If you install the Helper, you can also see the current CPU and GPU temperature.

    Fans are visible if the Helper is installed. The fan-icon rotation correlates with the physical fans RPM.

    Top-5 List of Applications using most CPU. Click an App in the list to switch to that App. Open Activity Monitor by clicking its icon. CPU usage per App is presented normalized across all CPU cores (0-100%). With the Helper, the list shows top-5 of all processes on the system, including background processes, with CPU usage aggregated into the parent process.

    Uptime is the time your computer has been working and available. Click the uptime row to see when your computer started, how long it has been asleep and awake.

  • CPU
  • Memory
  • Memory

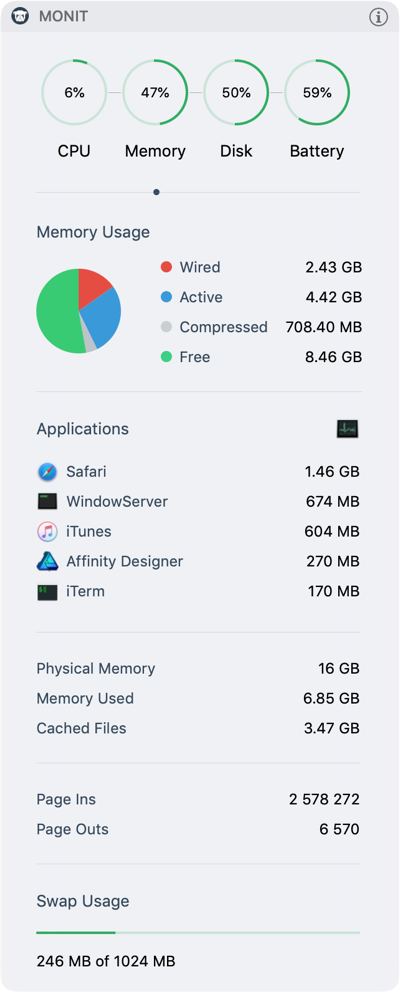
    Displays the memory usage of the system in a traditionally pie-chart. Wired memory is memory that is in active use and cannot be cached to disk. Active memory is memory that has recently been used or is in use by applications. Compressed memory is the amount of compressed memory in RAM. Free memory is memory not being used. Monit consider wired and active memory as memory in actual use.

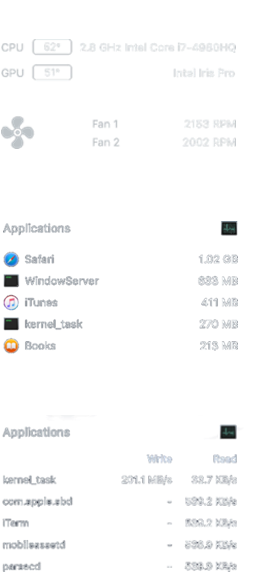
    Top-5 List of Applications using most Memory (RAM). Click an App in the list to switch to that App. Open Activity Monitor by clicking its icon. With the Helper, it is possible to show an exact representation of memory used by an application by aggregating memory used by child-processes into the parent process. You can then see how much memory e.g. Safari actually is using. Surprisingly much it turns out, especially if you have many open tabs (each tab is a separate child-process).

    Without the Helper, applications memory usage does not include memory used by child-processes and memory usage is reported as real-memory, which is memory used including shared resident memory.

    Physical Memory is the amount of RAM installed on your system. Cached Files is the size of files cached into unused memory to improve performance. Swap Used is the amount of space being used on your startup disk to swap unused files to and from RAM.

    Page Ins indicate how much data is being copied into RAM from the hard disk and Page Outs indicates how much data is being copied from RAM to the hard disk.

  • Disk

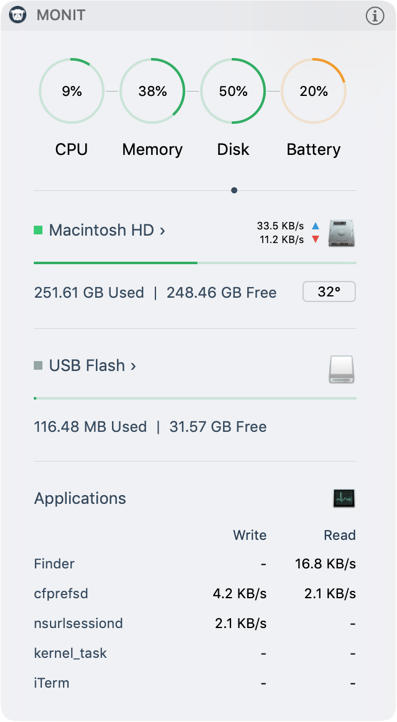
    Displays a list of all mounted disks. The first disk is the disk from which the system booted. This is also the disk the Disk gauge reports space usage for.

    Disk activity is displayed as a red and a blue triangle indicating the amount of bytes written and read from the disk per second.

    The horizontal line indicate disk usage in percentage. Below the line, you can see disk space used and space available.

    If your hard disk supports S.M.A.R.T. (Self-Monitoring, Analysis and Reporting Technology), Monit will query the S.M.A.R.T. status of your disk and display a green square if the status is okay or a red square if your hard disk is failing. If S.M.A.R.T. is supported, we can usually also read the temperature of the hard disk. A grey square indicate that the disk does not support S.M.A.R.T.

    Click the disk icon to popup more details about the disk, including total bytes read and written since boot time. The menu also contains an item for ejecting the disk if it is removable.

    The Applications Disk I/O panel is displayed if the Helper is installed. Here you can see which processes are currently reading and writing to disk. A small caveat (for now) is that the blue and red disk i/o triangles are not always in sync with this panel as the data is gathered in a different process.

  • Disk
  • Battery
  • Battery

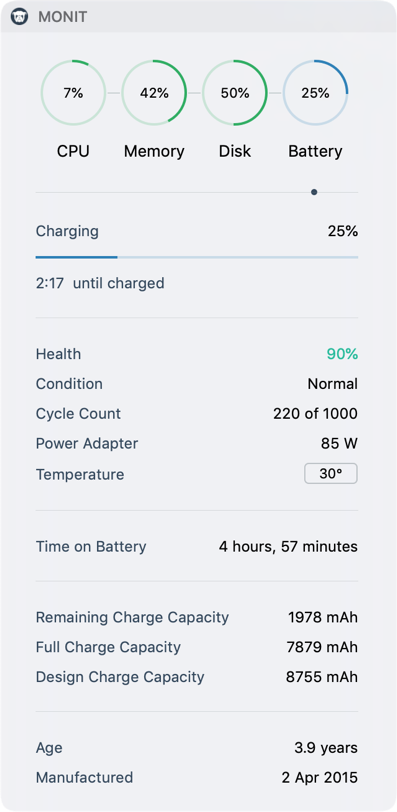
    Displays the time remaining if the battery is discharging or the time until the battery is fully charged when connected to a power supply. The battery gauge and remaining bar are color coded. On charging, the color is blue. On discharging, the color is green until 25% remains, then it changes to yellow. If less than 20% remains, the color changes to red.

    Health is a comparison between your current battery capacity and the capacity when the battery was new.

    Condition describes the battery's health status. Normal means the battery is functioning normal. Replace Soon or Replace Now means that the battery holds (significantly) less charge than it did when it was new. Service Battery indicate that the battery isn’t functioning normal. You can continue to use your MacBook on a power adapter, but with this condition, you might want to consider replacing your battery.

    Batteries are expected to function for a certain number of cycles. A cycle is the sum of total and partial discharge cycles throughout the life of the battery.

    Read more about your Macbook's battery.

    Time on Battery requires the Helper. It reports the time on the current power source (battery or AC) since the machine started or since the Helper was installed.

  • Network

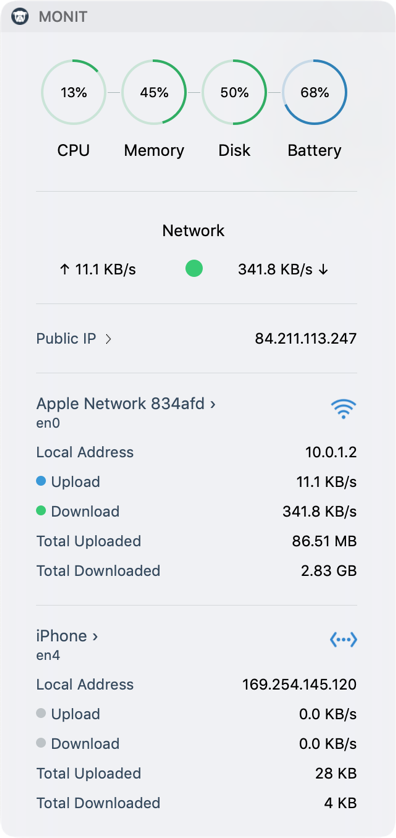
    If the computer is connected to the Internet, the Network circle is green, yellow if only connected to a local area network and red if there are no network connection.

    Your computer's Public IP address can be selected and copied. Double click to select and right mouse click to copy. Click the Public IP label to drop down more information about the computer's network connection. Such as the Host Name, Router and DNS settings. These values can also be selected and copied.

    All active Network Interfaces are listed and the icon indicates if the connection is over Wi-Fi wifi or Ethernet settings_ethernet. If your computer is connected to a local network, the Local Address is displayed. The current upload and download rate is indicated with blue and green led lights. Total uploaded and downloaded are the number of bytes uploaded and downloaded since the computer started.

    Click the network icon to see a popup with more information, such as the MAC address of the interface and the current Link Speed.

  • Network
  • Settings
  • Settings

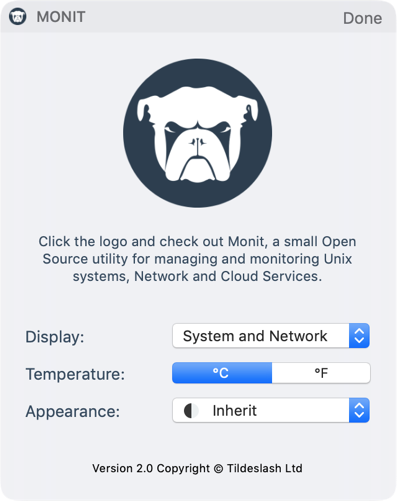
    A settings panel is provided by clicking the icon at the top-right corner of the widget. Click Done when done.

    You can select which part of the widget you want to Display. For instance, only the System panel (gauges), only the Network panel or both.

    Select °C to display the temperature in Celsius or °F for Fahrenheit.

    You can change the Appearance of the widget by selecting between two different color themes. The Inherit theme is the one displayed here and matches the default background used in the Notification Center.

  • Dark Mode

    Looking good in macOS Dark Mode

  • Dark Mode
  • Version 1.0.4

    Helper

    With the Monit Helper, the Monit Widget can display temperature, fan speed, show exact process resources usage and show disk i/o per process.

    The Helper is a small program that runs in the background and provides data to the Widget. The Helper does not use CPU if the Widget is not running and it uses only about 3 MB of RAM.

    The Helper is signed with our Developer ID certificate and Notarized with Apple. Should you want to uninstall the helper, just run this script in the terminal. The Helper only works with Monit Widget version 2.0 or later. Update Monit Widget on the App Store. Click the version number above to see the change log.

  • Helper.app
  • Installation
  • How to install

    First, open and close the Monit.app. This will register the MONIT Widget with the Notification Center. Then click Install Instructions below to learn how to install the Widget.

    Install instructions29 seconds

Frequently asked questions

If you have other questions or issues, please contact us.

  • Will there be an update for macOS Big Sur and later?

    The Monit Widget is only compatible with macOS 10 (Catalina) and earlier and is not compatible with macOS 11 (Big Sur) and later. This information is provided on the Mac App Store page, but may be easy to overlook. If you recently bought the Widget for a newer macOS we recommend requesting a refund from Apple at their designated refund request channel. It's worth mentioning that Apple has made changes to the way widgets work in macOS 11, and we are currently in the process of rewriting the Monit Widget as a menu bar application instead. This has unfortunately been a slow process. We'll post updates on twitter.

  • Can I see CPU temperature and fan-speed?

    Yes, if you download and install the Helper. An App Store App by itself is not allowed to read system sensors due to sandbox limitations.

  • Can I see all processes?

    The Top-5 App list will show Applications using the most resources. Download and install the Helper to see the top list of all processes, including background processes.

  • Are values in the Top-5 List correct?

    CPU and Memory usage are correct for the main Application process. With the Helper we can and do aggregate Memory and CPU used by an Application's child-processes and can show the exact top-5 processes using Memory and CPU.

  • What does the Thermal Gauge display?

    The Gauge displays the overall thermal state of the system. There are 4 thermal levels; normal, fair (fans running), serious and critical. The Thermal Apple API does not seem to work properly on older Macs. On MacBooks from 2015 and later it appears to work fine.

  • What about power consumption and battery life?

    The Monit Widget only runs when the Notification Center opens and stops ca 20 seconds after you close the Notification Center. The Monit Helper, only uses CPU when the Widget runs. This means that the Monit Widget and Helper will have almost zero power consumption and minimal impact on your battery life.

  • Why is Disk usage percent different from macOS?

    MacOS might underreport disk usage and ignore temporary and cached files while Monit simply show actual disk usage. Time Machine, for instance, store local snapshots which can fill up your disk, but macOS does not report space used by these files. To see actual disk usage, run this command in the terminal, /bin/df -H It should more or less match the Monit Widget.

  • Contact Information

    The Monit Widget is a product of Tildeslash Ltd. For general questions or comments regarding the Widget, please use this contact form

  • CONTACT

Message sent!

MONIT Widget

Gudvangen, Norway

Copyright © 2024 Tildeslash Ltd.