Up and running in 15 minutes!
With all features needed for system monitoring and error recovery. It's like having a watchdog with a toolbox in your container or server
MONIT
Barking at daemons
A birds-eye view of Monit
Use your keyboard arrows to navigate or swipe on mobile
Some examples in this presentation might only work with a recent version of Monit. Please download Monit below or use your package manager to install the latest version.
What to monitor?

Monit in Containers
Monit is an excellent choice for running as PID 1 (init) in containers. Monit handles both init responsibilities and service monitoring in one lightweight package. Read more.
How to monitor?
Monit is controlled via an easy to configure control file with a simple syntax. The file is called monitrc and resides in your home directory.
An example monitrc file is included with the Monit download. Open it in your favourite editor and follow along..
Starting and stopping
Start Monit from the command line:
$ monit
$ monit quit
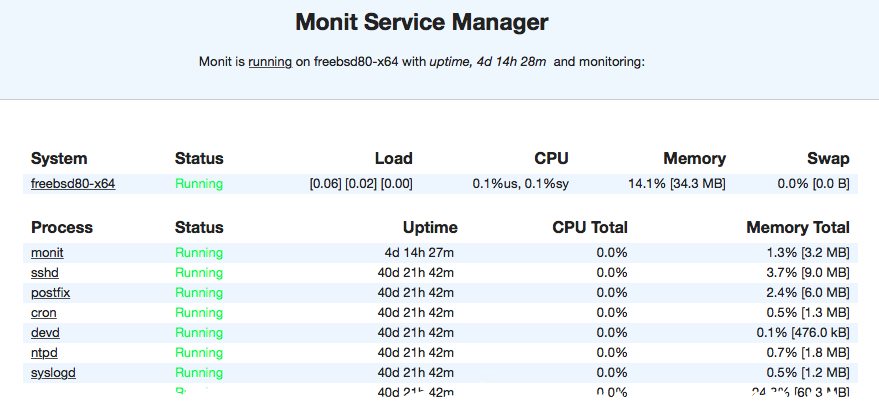
User Interface
In addition to the command line interface, Monit also provides a super lightweight Web-Interface you can use to check the status of all monitored services
Configuration Examples
Is your website up?
(1) check host mmonit.com with address mmonit.com
(2)       if failed port 80 protocol http then alert
(3) if failed port 443 protocol https then alert- Connects to and test the host mmonit.com
- Test using the HTTP protocol, if this fails, raise an alert
- Do the same test using HTTPS
You can add as many host checks as you need. Basically you can create your own pingdom and if you use M/Monit you will also get the ping and response-time charts.
Check a section on your site
check host mmonit.com with address mmonit.com
      if failed
         port 80 protocol http
         and status = 200
         and request /monit/ with content = "Monit [0-9.]+"
then alert..and your mail server?
check host smtp.example.com with address smtp.example.com
      if failed port 25 with protocol smtp then alert
See the pattern? A simple check against a host address on the service port and then the protocol to test. Here's another example where we check a MySQL server on localhost. In this case we also ping the host first to check that it is up
check host localhost with address 127.0.0.1
      if failed ping then alert
      if failed port 3306 protocol mysql then alert
Protocols
if failed port 25 and
    expect  "^220.*"
    send    "HELO localhost.localdomain\r\n"
    expect  "^250.*"
    send    "QUIT\r\n"
then alert
Check SSL certificate
check host mmonit.com with address mmonit.com
      if failed
         port 443
         with protocol https
         and certificate valid > 30 days
         use ssl options {verify: enable}
      then alert
I almost always forget to renew our SSL certificate, although I use the calendar to remind me. With the above test, Monit will remind me if the certificate at mmonit.com will expire within the next 30 days and continue to remind me with a red color in the UI. For good measure I also verify the SSL certificate so I know I'm testing the mmonit.com server
Cron-style scheduling
Monit also supports cron-style scheduling for running checks at specific times. The check executes once per minute at the scheduled time, independent of your poll cycle. This is perfect for scheduled tasks, periodic reports, or checks that should only run during specific hours.
check program database_backup with path /usr/local/bin/backup.sh
      every "0 2 * * *"
      if status != 0 then alert

check process webapp with pidfile /var/run/webapp.pid
      every "*/15 9-17 * * 1-5"
      ...
The first example runs a backup once daily at 2 AM. The second checks a process every 15 minutes during business hours (9 AM-5 PM) on weekdays.
Processes
Checking a Process
For this example, let us assume that your web-server is Apache, if not, no worries, the same applies to any process. Here is how we can check if Apache is running
check process apache with pidfile /var/run/httpd.pid That's all, Monit will check the process id (pid) in the given pid file and consult the system's process table and check if the process exist. If not, Monit will raise an alert. Next, we'll see how Monit can be configured to automatically start or restart Apache if it is not running.
Automatically start a Process
check process apache with pidfile /var/run/httpd.pid
      start program = "/etc/init.d/apache2 start"
      stop  program = "/etc/init.d/apache2 stop"
Tell Monit which program it should use to start the process if it is not running. We also add a stop program in case we would like to use Monit to stop the Apache process. What is useful here is that these programs already exist on your system as init, upstart or systemd scripts and you do not have to write them yourself.
Now, if the Apache process should stop for some reason, Monit will call the start program to automatically start Apache again.
Restart a Process
check process apache with pidfile /var/run/httpd.pid
      restart program  = "/etc/init.d/apache2 restart"
if failed port 80 protocol http then restartAvoid false positives
if failed port 80 protocol http for 2 cycles then restartChecked Resource Usage
You can check resources used by a process and perform actions if values goes outside specific bounds
check process apache with pidfile /var/run/httpd.pid
      ...
      if cpu > 95% for 2 cycles then alert
      if total cpu > 99% for 10 cycles then restart
      if memory > 50 MB then alert
      if total memory > 500 MB then restart
      if disk read > 10 MB/s for 2 cycles then alert
In the above example we check the following resources, cpu, total cpu (including child processes cpu usage), memory, total memory (including child processes memory usage) and disk read i/o. See the manual for even more resources that can be checked.
Managing Services
Having start, stop and restart programs defined for a service is convenient if Monit is used from the command line. For instance to shutdown a set of services graceful at once we can use
$ monit -g www stop
The above command line will call the stop program of all services belonging to the group www, which is quite useful for system administration. You can of course do the same to start or restart a single service or a group of services.
Avoid alert spam
Monit, like any monitoring system really, can be noisy and send a lot of email alerts. This can be very annoying, but luckily you can take steps to prevent this. Your primary tool for tuning Monit is the for n cycles statement
if total memory > 500 MB for 3 cycles then alert Use this statement with if-tests that produces too many alerts. How many cycles you should wait, if any, depends on the importance and stability of the service and how long a cycle is
Files, Directories and Disks
Monitoring Files
To keep with the Apache example. Let's say we want to test and perform a log rotate if Apache's access.log becomes too large
check file access.log with path /var/log/apache2/access_log
      if size > 250 MB then exec "/usr/sbin/logrotate -f apache"
Normally you will run the logrotate program once per day from crond, but if the log file suddenly should grow very large, Monit can perform an “emergency” rotate.
Checked File Changes
For security reasons you may want to monitor files for changes and get a notification if a file was tampered with (i.e. changed). The way to do this is to use the check file statement and utilize a checksum test. You can also test other attributes, such as file owner and file access permissions
check file apache with path /usr/sbin/httpd
      if failed checksum then alert
      if failed uid root then alert
      if failed gid root then alert
      if failed permission 755 then alert
Here we test the apache binary. The checksum test in line 2 will raise an alert if the binary was changed
Monitoring directories
Directories can be monitored for changes. In this example we use timestamp to alert if content was added or removed
check directory certificates with path /etc/ssl/certs/
      if changed timestamp then alert
You can also turn the table and monitor a directory that should change
check directory incomming with path /var/data/ftp
      if timestamp > 1 hour then alert
If your server spool incomming data on a regular basis, an alert can be raised if no new data has arrived in the last hour
Monitoring Filesystems
Monitor a hard disk or a filesystem and raise alerts if the device is about to run out of available space or becomes slow
check filesystem disk2 with path /dev/disk2
if space usage > 95% then alert
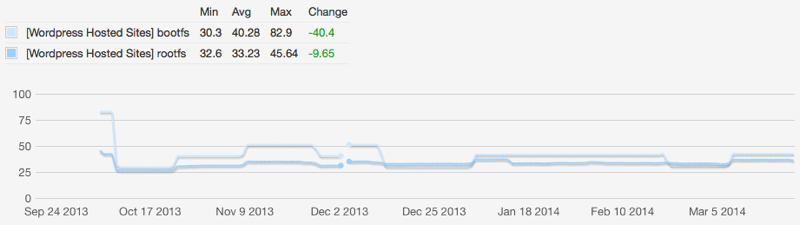
if service time > 300 milliseconds for 5 cycles then alertWith M/Monit you can view charts such as space usage, disk i/o, service time etc and predict when it is time to invest in more space or replace disks
Network
Check Network Interfaces
Monitor your network interfaces to be the first to know what is going in and out. Get an alert if the interface is down, or if the capacity changes. Monitor saturation, current upload and download bandwidth usage and total data transfers within the last 24 hours.
check network eth0 with interface eth0
      if failed link then alert
      if changed link then alert
The above will check if the network interface is up and if the link capacity is stable (for example if the mode unexpectedly drops from 1Gb/s to 10Mb/s, you will know).
Network Problems?
In case of a problem you can add a start and stop program to automatically restart the interface which might help. (Substitute with the relevant network commands for your system)
check network eth0 with address 10.0.1.3
      start program = '/sbin/ifup eth0'
      stop program = '/sbin/ifdown eth0'
      if failed link then restart
If the interface should fail, Monit will now automatically attempt restart and alert you. By adding a start and a stop program you can also restart the network interface from the Monit GUI.
Network Usage
Check network utilization, bandwidth usage, current transfer rate and total data transferred within the last 24 hours.
check network en0 with address "fe80::aa20:66ff:fe50:4f6%en0"
      if failed link then alert
      if changed link then alert
      if saturation > 80% then alert
      if total upload > 10 GB in last hour then exec "/usr/local/bin/script.sh"
Monit maintains a rolling count of total uploaded and downloaded bytes for the last 24 hours. In the above example we also show that instead of just sending an alert, you can execute a script if you choose. If you use M/Monit together with Monit, you can view time-serie charts of your network which can be very useful
Programs
Check Programs
Monit can execute a program and perform an action if the exit value indicates an error. This means that you can use Monit to perform basically any type of check you can write a script for. For instance, lets say you have a script that connects to MySQL and runs a query. If everything is okay, the script exit with 0 otherwise with 1
check program weekly_report with path /var/monit/programs/weekly_report.sh
    every "15 8 * * 1"
    if status != 0 then alert
This will run the above weekly_report.sh one time every Monday at 08:15.
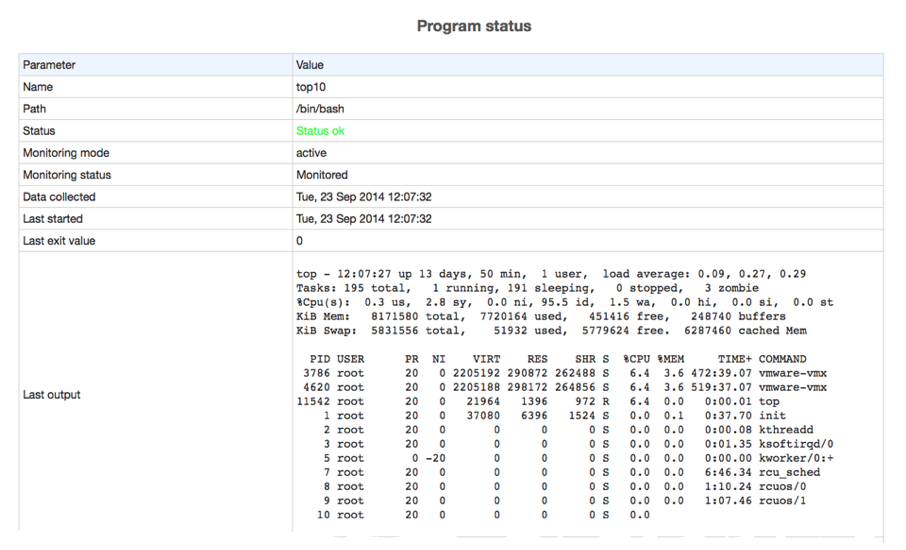
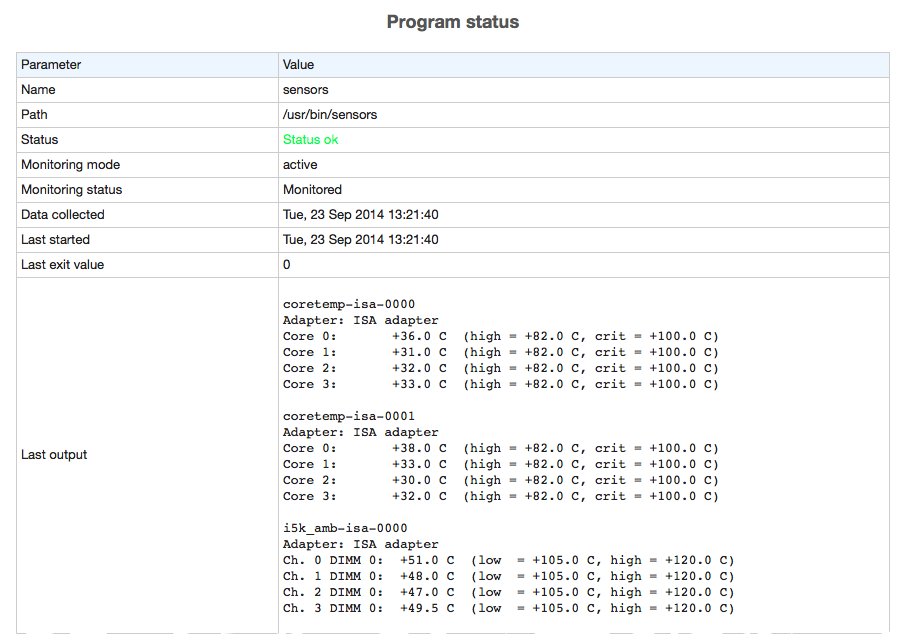
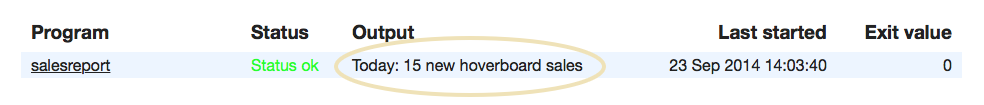
Output from check program
The output from your check program script is displayed in the Monit UI. In the dashboard, only the first line is displayed.
In the service details page, up to 1kB is displayed and if output goes over several lines, a mono-spaced font is used to retain formating. Here for example, we display the output of running top and sensors (press right-arrow).